Breathing life into Streamlit with Materialize & Redpanda
At work I had the opportunity to start getting familiar with Streamlit for a project so I got motivated to create a side project with it during the weekend.
After a bit of research I got to the conclusion that there are not enough examples of building live dashboards with Streamlit using streaming data. In order to change this I grabbed two of my recent favourite tools; Materialize and Redpanda. More on the role of each in the setup later.
All the code behind this post can be found here.
Architecture
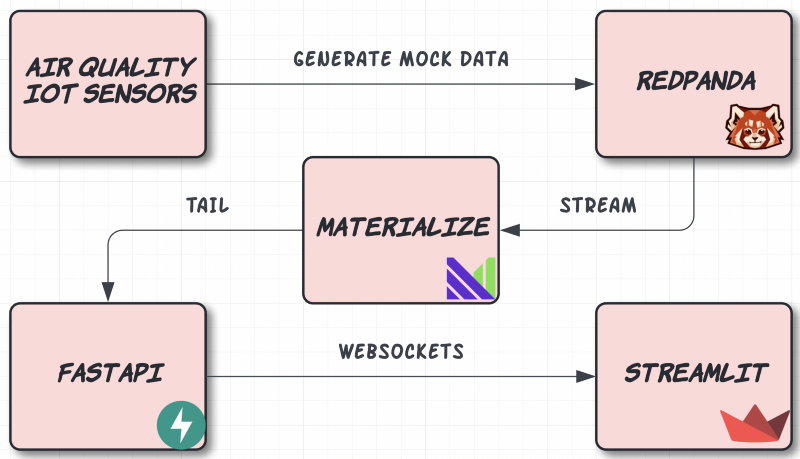
The architecture consists of 5 services, all dockerized.
Air Quality IoT Sensors
A shell script that generated Air Quality data and pumps it into Redpanda. The data has the following fields:
- id: a unique identifier for the event
- pm25: The atmospheric particulate matter that has a diameter of less than 2.5 micrometres, which is about 3% of the diameter of human hair.
- pm10: The particles with a diameter of 10 micrometers and they are also called fine particles.
- lat: Randomized latitude coordinates.
- lng: Randomized longitude coordinates.
Redpanda
A storage engine, optimized for streaming data.
Materialize
A Streaming SQL database.
For this example we leverage the TAIL command. TAIL streams updates from a source, table, or view as they occur.
Fundamentally, TAIL produces a sequence of updates. An update describes either the insertion or deletion of a row to the relation at a specific time. Taken together, the updates describes the complete set of changes to a relation, in order, while the TAIL is active.
FastAPI
An amazing API framework written in Python. In our example it is responsbile to read data from Materialize and streaming it to the dashboard via websockets.
Streamlit
A Python-based framework for creating data applications in minutes. Every wondered why is it called Streamlit? Me too! Apparently it was a spelling mistake: https://discuss.streamlit.io/t/why-is-streamlit-called-streamlit/339
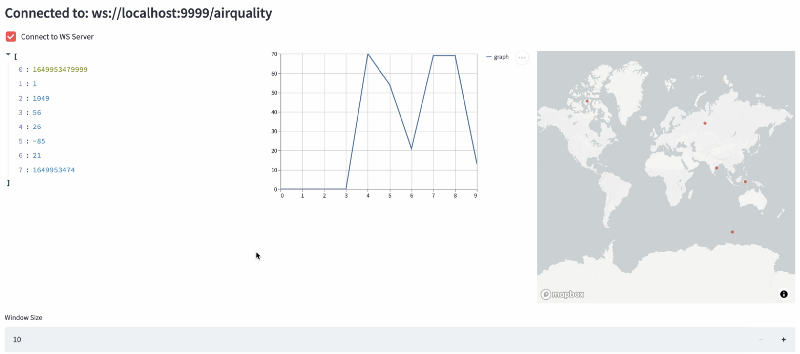
Our dashboard will receive the Air Quality data through websockets, and will display three things, organized in three columns:
- The raw data
- A simple line chart showing the PM2.5 values in a set time window
- A map showing the source of the PM2.5 values in the same time window
The time window is dynamically adjustable.
Wiring things together
As Redpanda is a Kafka-compatible datastore, in our mock data shell script all we have to do is create a topic with the included cli utility, Redpanda Keeper (rpk).rpk topic create sensors
and in an infinite loop we can start sending randomly generated data!while true ; do
< generate random numbers for each field > JSON_STRING=< format numbers into a json string > echo ${JSON_STRING} ; done | rpk topic produce sensors
After our data is in Redpanda we can create the infrastructure inside Materialize. In order to create every required object you can run the script called init-materialized.sql in the root of the repository.psql -U materialize -h localhost -p 6875 -d materialize -f init-materialized.sql
One of the nice things about Materialize is its Postgres compatibility, hence we can use psql to connect to the database and run our script. This script does 4 things for us:
- Creates a Redpanda source object.CREATE
SOURCE sensors
FROM KAFKA BROKER 'redpanda:9092' TOPIC 'sensors'
FORMAT BYTES;
2. Creates a non-materialized view which parses the data received from the source into a more SQL friendly ephemeral view.CREATE VIEW sensors_data AS
SELECT *
FROM (
SELECT (data ->>'id')::int AS id,
(data ->>'pm25')::float AS pm25,
(data ->>'pm10')::float AS pm10,
(data ->>'geo_lat')::float AS geo_lat,
(data ->>'geo_lon')::float AS geo_lon,
(data ->>'timestamp')::float AS timestamp
FROM (
SELECT CAST(data AS jsonb) AS data
FROM (
SELECT convert_from(data, 'utf8') AS data
FROM sensors
)
)
);
3. Creates a materialized view that will hold all records in the last 10 minutes
Note that we are using the mz_logical_timestamp() function rather than the now() function. In Materialize, now() doesn’t represent the system time, as it does in most systems; it represents the time with timezone when the query was executed. It cannot be used when creating views.
mz_logical_timestamp() comes closer to what now() typically indicates. It represents the logical time at which a query executes. More on this in the official documentation.CREATE MATERIALIZED VIEW sensors_view AS
SELECT *
FROM sensors_data
WHERE mz_logical_timestamp() < (timestamp * 1000 + 100000)::numeric;
4. Creates a materialized view that will only include data from the last second so we can see the dataflow and use it for our Websockets in FastAPI:CREATE MATERIALIZED VIEW sensors_view_1s AS
SELECT *
FROM sensors_data
WHERE mz_logical_timestamp() < (timestamp * 1000 + 6000)::numeric;
After our materialized views are ready we need to query this data in a streaming fashion and somehow propagate it to our Streamlit dashboard. As a middle man we will use FastAPI, a brilliant Python framework.
As Materialize strives to provide a PostgreSQL compatible API we are able to create a connection to the database with good old SQLAlchemy.from sqlalchemy import create_engineDB_URL = "postgresql://materialize:materialize@localhost:6875/materialize"engine = create_engine(DB_URL)connection = engine.raw_connection()
Our async event generator function looks like this:def new_messages():
results = engine.execute("SELECT count(*) FROM sensors_view_1s")
return None if results.fetchone()[0] == 0 else True
async def event_generator():
if new_messages():
connection = engine.raw_connection()
with connection.cursor() as cur:
cur.execute("DECLARE c CURSOR FOR TAIL sensors_view_1s")
cur.execute("FETCH ALL c")
for row in cur:
yield row
await asyncio.sleep(MESSAGE_STREAM_DELAY)
The recommended way to use TAIL is with DECLARE and FETCH. These must be used within a transaction, with only one DECLARE per transaction. This allows you to limit the number of rows and the time window of your requests. First, declare a TAIL cursor:DECLARE c CURSOR FOR TAIL t;# Now use FETCH in a loop to retrieve each batch of results as soon as it is readyFETCH ALL c;
That will retrieve all of the rows that are currently available. If there are no rows available, it will wait until there are some ready and return those.
With the event generator in place all we have to do is wrap it in a function decorated with FastAPIs websocket decorator which does all the heavy work of creating a websocket endpoint in the background for us.@app.websocket("/airquality")
async def websocket_endpoint(websocket: WebSocket):
await manager.connect(websocket)
try:
while True:
async for data in event_generator():
await websocket.send_json(data)
except WebSocketDisconnect:
manager.disconnect(websocket)
Our final step is to define the async consumer in our Streamlit app.
The app will create an async http client session on every startup, connect to the defined websocket endpoint and start reading incoming messages.async def consumer_airquality(...): async with aiohttp.ClientSession(trust_env=True) as session:
async with session.ws_connect(WS_CONN) as websocket:
async for message in websocket:
data = message.json() < visualize stuff >
And that’s it!
Running the project
All you have to do in order to run the demo on your machine is:
- Clone the repository from https://github.com/danthelion/materialize-streamlitgit clone git@github.com:danthelion/materialize-streamlit.git
2. Run all the services with docker-composedocker-compose up
3. Run the script to prepare the Materialize database.psql -U materialize -h localhost -p 6875 -d materialize -f init-materialized.sql
You’ll maybe have to wait a few minutes until everything starts up and the data starts flowing.
Navigate to http://localhost:8501/, connect to the websocket and and you should be seeing the live dashboard! Make sure to try out the different visualization types using the selector.
Attributions
The data ingestion part is based on the amazingly helpful example by Bobby Iliev (check out his stuff more more amazing Materialize projects!) and the Streamlit websocket connection was inspired by this template.
Member discussion