The definitive guide to debugging dbt
Debugging errors in your dbt projects is an essential skill for ensuring the quality and reliability of your data transformations and analytics pipelines. While dbt provides a powerful and intuitive framework for managing your data transformations, debugging issues that arise during development and deployment is a crucial part of the process.
In this article, we'll explore the ways dbt can break, and take a look at best practices for debugging errors in dbt projects.
Understanding the dbt model lifecycle
Before we dive into the debugging best practices, let's briefly review the dbt workflow to understand what happens under the surface:
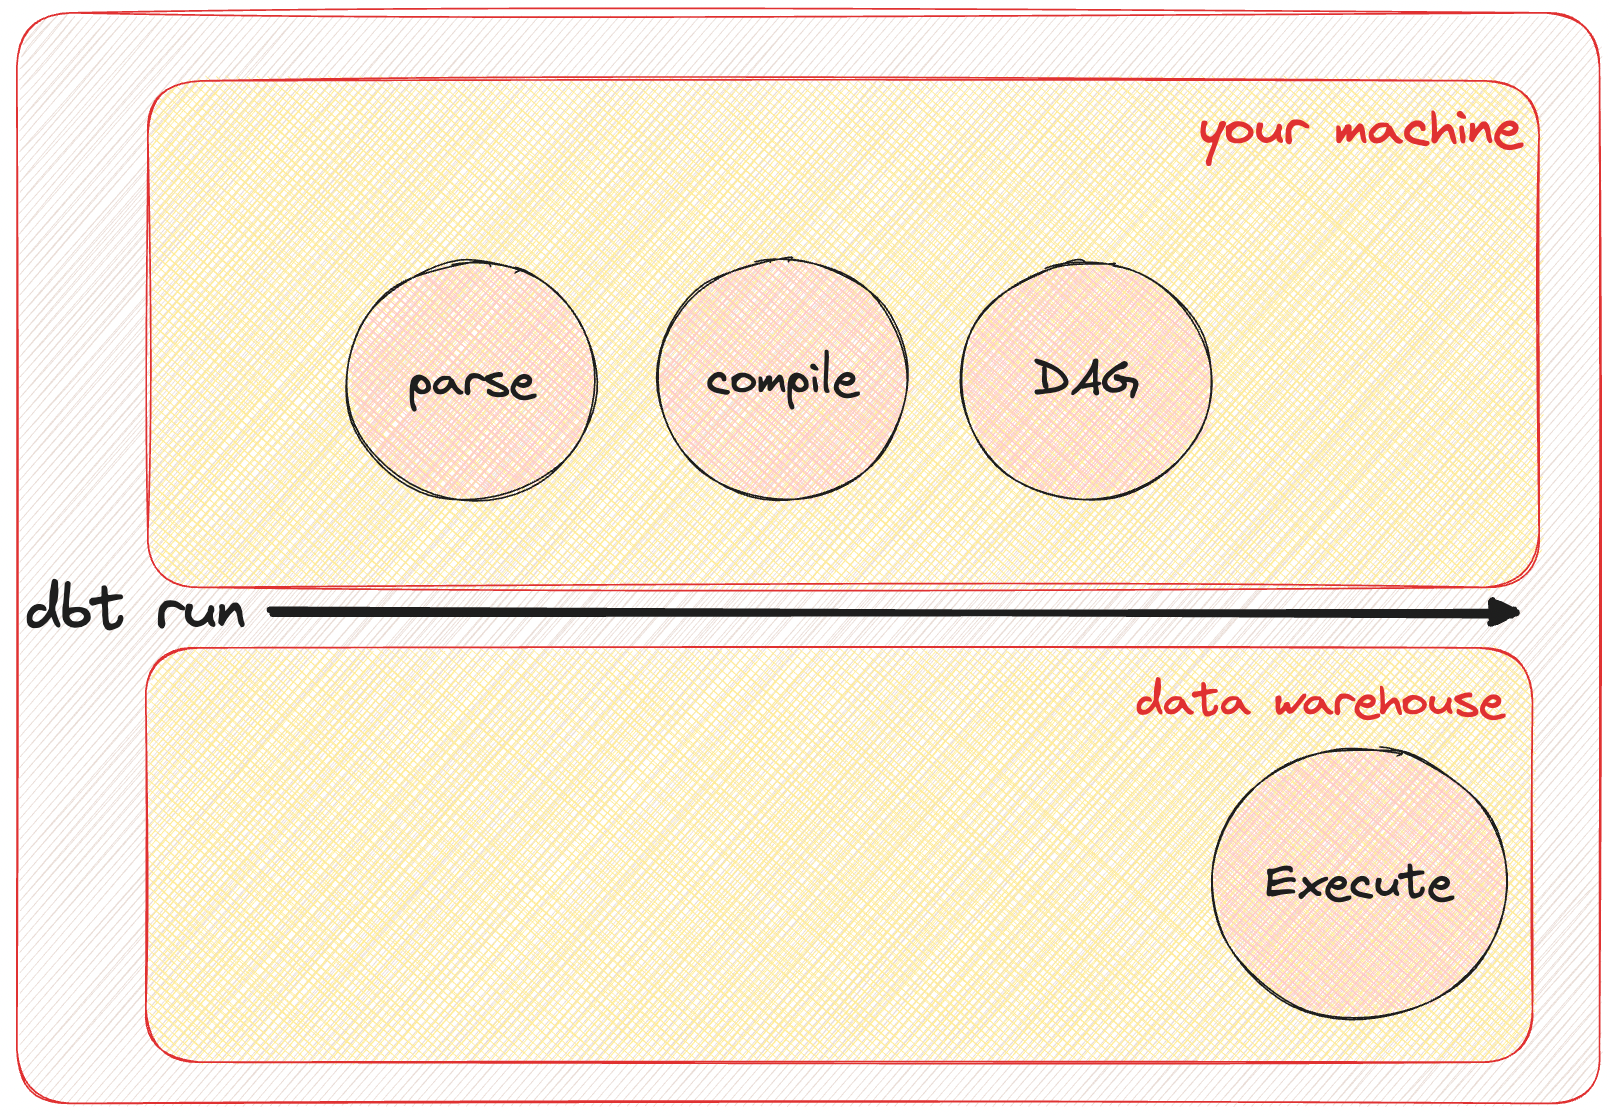
- Initialize: Check that the project is a dbt project and establish a connection to the data warehouse.
- Parsing: Parse all the code in your project, including Jinja snippets in
.sqlfiles and.ymlconfiguration files. - Compilation: Compile all your models and macros, creating SQL statements that are ready for execution.
- Dependency Graph: Compile the dependencies into a graph, ensuring that it's acyclic and can be executed in the correct order.
- SQL Execution: Run the compiled SQL statements against the data warehouse to create or update tables and views.
- Testing: Validate assumptions by running queries that test the models' outputs and data quality.
Now, you can run into various errors in all of these steps, let's explore the general process of debugging and the actions you can take to effectively debug errors in your dbt project.
Identifying Error Types
First of all, we have to identify the type of error we are dealing with. Knowing which part of the lifecycle (see the 6 points above) we are currently in when we see the error message hit us in the face is the most important hint we'll need in order to proceed.
There are four main categories of errors we'll come across:
- Runtime Errors
- Compilation Errors
- Dependency Errors
- Database Error
Let's take a look at these four in more detail.
Runtime error
Runtime errors are most commonly encountered even before dbt can execute any SQL against our target data warehouse. We usually see this if our project is misconfigured or the database is unreachable.
Runtime errors come in many shapes and sizes:
Runtime Error
  fatal: Not a dbt project (or any of the parent directories). Missing dbt_project.yml file
Runtime Error
Could not run dbt
Could not find profile named 'jaffle_shop_analytics' Database error while listing schemas in database "analytics"
Database Error
250001 (08001): Failed to connect to DB: org.snowflakecomputing.com:443. Incorrect username or password was specified.Usually, the error message itself is the best pointer on what the required fix is, but we'll take a look at the most common issues and their remedies below.
Sometimes, you might run into errors that indicate that a model (which exists) is not found. These have been resolved by using dbt run --no-partial-parse.
The internal manifest generated by the preceding parse step is re-used every time you execute a new dbt command to spare parsing the whole project from scratch again as that would take a lot of time.
Sometimes, it can happen that when dbt re-uses this manifest from a previous run it fails to properly diff it against the latest state of the models (not sure about the exact issue, I'm sure it's some weird disk/cache/diff-related bug internally to dbt), which can be rectified by forcing a full parse from scratch again with the --no-partial-parse flag.
As for the other issues, first things first, make sure your dbt_project.yml file is in the root of the project folder you are executing your dbt command from and there is a matching connection profile in your profiles.yml configuration file.
If the top of your dbt_project.yml file contains looks something like this:
name: 'jaffle_shop_analytics'
version: '1.0.0'
config-version: 2

require-dbt-version: [">=1.4.0", "<2.0.0"]

profile: 'jaffle_shop_analytics'
Then, your profiles.yml will have to contain a connection configuration for the key jaffle_shop_analytics, such as this:
jaffle_shop_analytics:
  outputs:
    dev:
      account: $SNOWFLAKE_ACCOUNT
      authenticator: externalbrowser
      database: $SNOWFLAKE_DATABASE
      schema: $SNOWFLAKE_SCHEMA
      threads: 8
      type: snowflake
      user: $SNOWFLAKE_USER
      warehouse: $SNOWFLAKE_WAREHOUSE
  target: dev
Most commonly, the profiles.yml file lives in your home folder at ~/.dbt/.profiles.yml and you are running every dbt command from the root of your dbt project, but it is possible to load profiles from a custom location and execute dbt commands from a different folder!
Where's my profiles.yml?? Don't worry! Run dbt debug --config-dir to quickly check where dbt is looking for itTo tailor your dbt (data build tool) workflow to your preferences, you can employ environment variables to define directory locations for both profiles and project configurations. This flexibility enhances your ability to manage and structure your dbt projects according to your needs.
Let's explore how you can utilize environment variables for these configurations.
Profiles Configuration
The profiles.yml file is vital for establishing connections to your data warehouses in dbt. While dbt follows a default search pattern, you can specify a custom directory for profiles using the --profiles-dir option or the DBT_PROFILES_DIR environment variable.
Here's the sequence dbt uses to locate profiles.yml:
- --profiles-dir: Directly search in the specified directory using the
--profiles-diroption. - DBT_PROFILES_DIR Environment Variable: Set the
DBT_PROFILES_DIRenvironment variable to point to your profiles configuration. - Current Working Directory: Include the current working directory in the search process.
- ~/.dbt/ Directory: If not found, dbt searches in the default
~/.dbt/directory.
The quickest way to test your database connection is by running dbt debug, don't be afraid to run it as many times as necessary!Project Configuration
Similarly, you can control the location of the dbt_project.yml file using environment variables. This file contains essential project settings. Customize its location using the --project-dir option or the DBT_PROJECT_DIR environment variable.
Here's how dbt locates dbt_project.yml:
- --project-dir: Directly search in the specified directory using the
--project-diroption. - DBT_PROJECT_DIR Environment Variable: Set the
DBT_PROJECT_DIRenvironment variable to define the project configuration folder. - Current Working Directory: Check the current working directory for
dbt_project.yml.
By leveraging environment variables for profile and project configurations, you can efficiently structure your dbt projects and ensure consistency across different environments or collaborations.
Compilation Error
The compilation step involves transforming your dbt models and macros into executable SQL statements. Dbt compiles your code, resolving Jinja expressions and macros, resulting in SQL code that can be executed against the data warehouse.
In this step, various things can cause errors. This is when dbt evaluates references in models by checking if the {{ ref(model) }} snippets point to existing models, parses all Jinja code in models and macros, and also, this is when dbt validates the property yaml files next to your models.
For the reference errors, the most important thing to do is verify if the model you are referencing actually exists. As for the yaml side, make sure to use a proper IDE that helps you maintain yaml formatting.
The more interesting errors here happen when there's something funky going on in your Jinja code. Macros are complicated and debugging them is even more complex.
If you find yourself looking confused at how macros work, don't worry, metaprogramming is a notoriously complex technique which often trips up seasoned software engineers as well.
The first and most important thing to do is isolate the source of the error we are seeing. A Compilation error could look something like this:
10:36:19  Running with dbt=1.4.6
10:36:19  Unable to do partial parsing because of a version mismatch
10:36:20  Encountered an error:
Compilation Error in model int_model (models/marts/core/intermediate/int_model.sql)
  unsupported operand type(s) for -: 'str' and 'int'
Great! So we know that our int_model triggers this error. If I look into the model code, I can see that there is a line that looks fishy:
{% set a = 1 %}
{% set b = 'x' %}
{% set c = a + b %}
Jinja snippets can be either inline in your models or factored out into a macro, from a debugging perspective it doesn't matter.
Now, debugging Jinja itself is a great topic for a separate article, for now, it's enough to know that Jinja is a Python-based templating engine, which has some debugging capabilities that can help us out!
To enable the interactive Jinja debugger, place a breakpoint above the line that you suspect is triggering the error:
{% set a = 1 %}
{% set b = 'x' %}

{{ debug() }}

{% set c = a + b %}
Now, let's rerun our compile command with a flag that enables the debugger to be triggered:
DBT_MACRO_DEBUGGING=1 dbt compile -m int_modelThis will drop us into an interactive ipdb debugger (stands for IPython-debugger)
10:48:33  Running with dbt=1.4.6
> /workspaces/analytics/fe3f4b22a39537e2e33cc064(123)macro()

ipdb>
For a quick glance at the tools available to help us debug, run h:
ipdb> h

Documented commands (type help <topic>):
========================================
EOF    clear      display  l         pfile    return           tbreak     where
a      commands   down     list      pinfo    retval           u
alias  condition  enable   ll        pinfo2   run              unalias
args   cont       exit     longlist  pp       rv               undisplay
b      context    h        n         psource  s                unt
break  continue   help     next      q        skip_hidden      until
bt     d          ignore   p         quit     skip_predicates  up
c      debug      j        pdef      r        source           w
cl     disable    jump     pdoc      restart  step             whatis

Miscellaneous help topics:
==========================
exec  pdb

Undocumented commands:
======================
interact
Woah! That's a lot of commands, neat. For a detailed article on debugging your macros this way, take a look at this page.
For now, we can just quickly check the two variables that are causing our error:
ipdb> locals().keys()
dict_keys(['t_3', 'l_1_adapter', 'l_1_ref', 'l_1_debug', 'l_1_a', 'l_1_b', 'l_1_c', 't_4', 'l_3_loop', 'l_3_col', 't_5', 'concat', 'context', 'environment', 'missing', 'resolve', 't_1', 't_2', 'undefined'])

ipdb> p l_1_a
1

ipdb> p l_1_b
'x'
This way, we can quickly see what is the cause of the issue; a type mismatch! This is obviously a very boiled-down example, but the debugging process works for most errors.
If you have complex macros in your project, make sure you are comfortable with the debugger as it can save you a ton of time!
Dependency Errors
After successful compilation, dbt creates a dependency graph based on the relationships between your models and macros. This graph ensures that dbt runs the models in the correct order to satisfy dependencies.
Pretty much the only error that can occur here is a circular dependency, which is not allowed under the DAG construct (see my other article on the theory behind DAGs!).
Encountered an error:

Found a cycle: model.analytics.int_model --> model.analytics.mid_model --> model.analytics.int_model
To fix these issues, visit all {{ ref(model) }} references in the guilty models and make sure there's no cycle!
If you want to reference the current model during runtime, you can do so by using the special this variable, like {{ this }}.
Database Errors
These errors actually come from the data warehouse itself, not dbt.
dbt run

Completed with 1 error and 0 warnings:

Database Error in model customers (models/int_model.sql)
  001003 (42000): SQL compilation error:
  ERROR: Snowflake: bby what is u doin
  compiled SQL at target/run/jaffle_shop_analytics/models/customers.sql
After dbt compiles the models into executable SQL files, it starts executing them according to the dependency graph. If a node fails, DAG execution doesn't stop. dbt will collect all failed executions and their output from the warehouse and present it to you at the end of the run.
Just a few examples from the infinite set of complaints a data warehouse will throw at you:
- Syntax Errors: Mistyped keywords or missing punctuation can lead to syntax errors in your SQL code.
- Commas and Formatting: Errors related to commas, semicolons, and formatting can disrupt your query structure.
- Data Type Mismatches: Attempting operations with incompatible data types, like casting a string to an integer, can cause data type mismatch errors.
- Conflicts with Underlying Data: SQL that clashes with existing database data can result in errors or unexpected behavior.
- Database Error Messages: During SQL execution, the database identifies errors and returns informative error messages.
The best way to tackle errors at this stage is to compile the model into a SQL query and head over to either the UI of our data warehouse or an IDE which we can use to run it.
If you peep the error message you can see that dbt saves the compiled model:
compiled SQL at target/run/jaffle_shop_analytics/models/customers.sqlThis also contains the materialization part of the model, such as the CTAS statement around the SELECT, which we don't necessarily need for debugging, so it's easier to just compile the model and copy it to your clipboard:
dbt compile -m int_model | pbcopypbcopy is a built-in MacOS utility that you can use to pipe the output of a preceding command straight into your clipboard
Now, head over to your data warehouse and iterate on the raw SQL query for as long as there are errors, then head back to your dbt model and update it accordingly.
Logs
dbt produces some DEBUG logs as well, which are available in the debug log file (logs/dbt.log). The text-formatted log messages in this file include all DEBUG-level events, as well as contextual information, such as log level and thread
Conclusion

Debugging is an essential skill for anyone working with data transformations using dbt. As you navigate the complexities of the dbt workflow, understanding the various steps involved, recognizing common error types, and employing effective debugging practices will empower you to create robust and accurate data pipelines.
By carefully reading error messages, isolating problems, leveraging compiled files and logs, and seeking assistance when needed, you can efficiently troubleshoot issues that arise during the development and execution of your dbt projects. Remember that debugging is not just about fixing errors; it's a process of learning, improving, and honing your skills.
As you continue your journey with dbt, embrace the debugging process as an opportunity to enhance your problem-solving abilities and become a more proficient data engineer or analyst. By following best practices and consistently refining your debugging techniques, you'll be well-equipped to create reliable, efficient, and impactful data transformations that drive better insights and decisions. Happy debugging!
Member discussion