Visualizing Twitter trends live: Redpanda, Materialize and dbt
Experimenting with new data tools is always fun; Today we’ll take a look at how we can leverage Materialize to build a live map of trending Twitter topics.
We’ll be using Redpanda as a fully Kafka-compatible storage layer for our data, from where we’ll build the live and breathing materialized views using Materialize, all defined in dbt.
The actual map for the visualization part will be created using Metabase, as it is supported by Materialize.
The code for the example can be found here: https://github.com/danthelion/twitter-trending
The base of this example is based on the Materialize 2022 Hackday project, which is a great starting point if you are interested in this stack, props to the Materialize team for creating it!
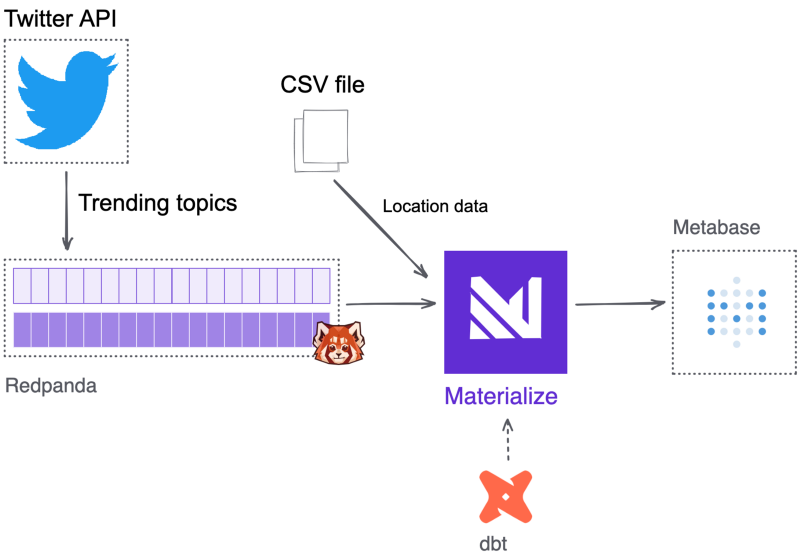
Architecture
- twitter.py — A Kafka producer written in Python that polls Twitter every 15 seconds (to avoid rate limiting) for trending topics for a location.
- Redpanda — A storage engine, optimized for streaming data.
- Materialize— SQL streaming database.
- dbt — A data transformation tool that enables data analysts and engineers to transform, test and document data in the cloud data warehouse.
- Metabase — An open source Business Intelligence server.
Installation
Requirements:
Up and running
⚠️️ M1 Mac users; first run this so you can fetch the proper Docker images for your machine:export ARCH=linux/arm64 MIMG=iwalucas
The ingestion part in our docker-compose.yml looks like this:data-generator:
build: ./data-generator
container_name: data-generator
depends_on:
redpanda: { condition: service_healthy }
redpanda:
image: docker.vectorized.io/vectorized/redpanda:v21.11.3
container_name: redpanda
command:
- redpanda start
- --overprovisioned
- --smp 1
- --memory 1G
- --reserve-memory 0M
- --node-id 0
- --check=false
- --kafka-addr 0.0.0.0:9092
- --advertise-kafka-addr redpanda:9092
- --pandaproxy-addr 0.0.0.0:8082
- --advertise-pandaproxy-addr redpanda:8082
- --set redpanda.enable_transactions=true
- --set redpanda.enable_idempotence=true
- --set redpanda.auto_create_topics_enabled=true
ports:
- "9092:9092"
- "8081:8081"
- "8082:8082"
healthcheck: { test: curl -f localhost:9644/v1/status/ready, interval: 1s, start_period: 30s }
data-generator is the small Python based Kafka producer that polls the Twitter API for new trending topic data every 15 seconds. It sends this data into a Redpanda topic called trending_data .
Before trying to run anythin, make sure to edit the data-generator/.env file so they contain your Twitter developer credentials. Bring up the services using docker-compose up -d .
You can get a list of existing topics by running:docker-compose exec redpanda rpk topic list
And you are able to check the contents of the topic with the following command:docker-compose exec redpanda rpk topic consume trending_data
The fun part
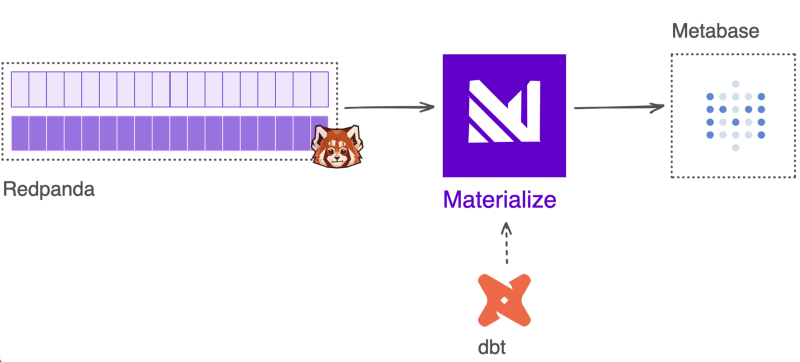
In a little bit more detail about these services and their role in our example:
Materialize
Materialize is set up to consume streaming sample customer information from Redpanda. Any sources and transformations are defined through dbt!
mzcli
A psql-like SQL client, so you can easily connect to the running Materialize instance, but if you have a postgres client installed on your localed development machine, you can omit this service.
dbt
dbt acts as the SQL transformation layer. Using the dbt-materialize adapter, you can build and run models to transform the streaming source data in real time.
Metabase
One of the ways to get data out of Materialize is through visualizing it. In this example I used Metabase to query data from the materialized views in order to explore the dataset in real time.
These services are defined as follows: materialized:
image: materialize/materialized:v0.20.0
container_name: materialized
command: -w1
ports:
- "6875:6875"
volumes:
- ./data/worldcities.csv:/tmp/worldcities.csv
mzcli:
image: materialize/cli
container_name: mzcli
dbt:
build:
context: ./dbt
target: dbt-third-party
args:
- build_for=${ARCH}
container_name: dbt
ports:
- "8000:8080"
volumes:
- ./dbt/profiles.yml:/root/.dbt/profiles.yml
- ./dbt/:/usr/app/dbt
stdin_open: true
tty: true
depends_on:
- materialized
metabase:
image: ${MIMG}/metabase
container_name: metabase
depends_on:
- materialized
ports:
- "3030:3000"
Our enrichment data, which contains metadata about cities from around the world is located at data/worldcities.csv . This file is mapped into the Materialize container as a Docker volume so we will be able to create a source from it and join it to our trending topic data.
Up & Running
After you brought up all the services using docker-compose up -d , the next step is to run our dbt models.
Our models are organized in the following structure:❯ tree
.
└── twitter_trending
├── marts
│ └── twitter
│ ├── fct_twitter.yml
│ └── fct_twitter_trending.sql
├── sources
│ └── twitter
│ ├── rp_twitter_trending.sql
│ ├── src_twitter.yml
│ └── worldcities.sql
└── staging
└── twitter
├── stg_twitter.yml
├── stg_twitter_trending.sql
└── stg_worldcities.sql
The source definitions under sources/twitter is where we tell Materialize to connect to Redpanda create two source objects.
First is the Redpanda source which will be responsible for streaming our trending topic information into Materialize.CREATE SOURCE {{ source_name }}
FROM KAFKA BROKER 'redpanda:9092' TOPIC 'twitter_trending'
FORMAT AVRO USING CONFLUENT SCHEMA REGISTRY 'http://redpanda:8081'
ENVELOPE DEBEZIUM;
The second source is our enrichment data, in the form of a static CSV file.CREATE SOURCE {{ source_name }}
FROM FILE '/tmp/worldcities.csv' COMPRESSION NONE
FORMAT CSV WITH HEADER
DELIMITED BY '|';
The staging view in this example (staging/twitter/stg_twitter_trending.yml ) is where we convert the json stream from the Redpanda topic into a properly typed Materialize dataset.WITH source AS (
SELECT * FROM {{ ref('rp_twitter_trending') }}
),
converted AS (
SELECT convert_from(data, 'utf8') AS data FROM source
),
casted AS (
SELECT cast(data AS jsonb) AS data FROM converted
),
renamed AS (
SELECT
(data->'location'->>'name')::string as location_name,
(data->'location'->>'country')::string as location_country,
(data->'location'->>'woeid')::string as woeid,
(data->'trends'->0->'trends')::jsonb as trends,
(data->'trends'->0->>'as_of')::timestamp as trend_as_of
FROM casted
),
final AS (
SELECT
location_name,
location_country,
woeid,
jsonb_array_elements(trends)->>'name' as trend_name,
TRIM(jsonb_array_elements(trends)->>'tweet_volume')::integer as trend_volume,
trend_as_of
FROM renamed
)
SELECT * FROM final
We also do some initial data cleaning here to make our life easier in the visualization phase.
In the file marts/fct_twitter_trending.sql we join the two staging tables together in order to create an analytical view of the top trending twitter topic for each location, enriched with latitude and longitude data so we can easily visualize it.with ranked_trends as (
select tt.location_name
, tt.location_country
, tt.trend_name
, tt.trend_volume
, tt.trend_as_of as trend_date
, wc.lat::float as location_latitude
, wc.lng::float as location_longitude
, ROW_NUMBER() over (partition by tt.woeid order by tt.trend_volume desc) as trend_rank
from {{ ref('stg_twitter_trending') }} tt
join {{ ref('stg_worldcities') }} wc
on tt.location_name = wc.city and tt.location_country = wc.country
where tt.trend_volume > 0
)
select location_name, location_country, trend_volume, trend_name, location_latitude, location_longitude, trend_date
from ranked_trends
where trend_rank = 1
To run our dbt models, first enter our dbt container:docker exec -it dbt /bin/bash
and then we can just run our models as usual.dbt depsdbt run
To inspect our Materialize database we’ll start the mzcli servicedocker-compose run mzcli
Similarly you could connect via psql.
psql -U materialize -h localhost -p 6875 -d materializeTo get a quick overview of what is inside our database we can use some built in commandsSHOW SOURCES; name
-----------------------
rp_twitter_trending
worldcitiesSHOW VIEWS; name
------------------------
fct_twitter_trending
stg_twitter_trending
stg_worldcities
Try running a query against fct_twitter_trending, this is our materialized view which holds our live data.
The last step in our little adventure would be to head over to http://localhost:3030 and set up a connection to our Materialize database.
Database: PostgreSQL
Name: twitter_trending
Host: materialized
Port: 6875
Database name: materialize
Database username: materialize
Database password: Leave empty
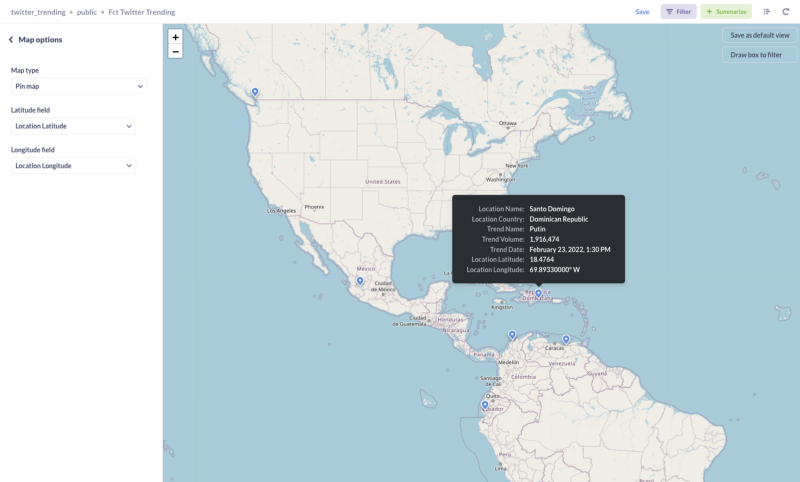
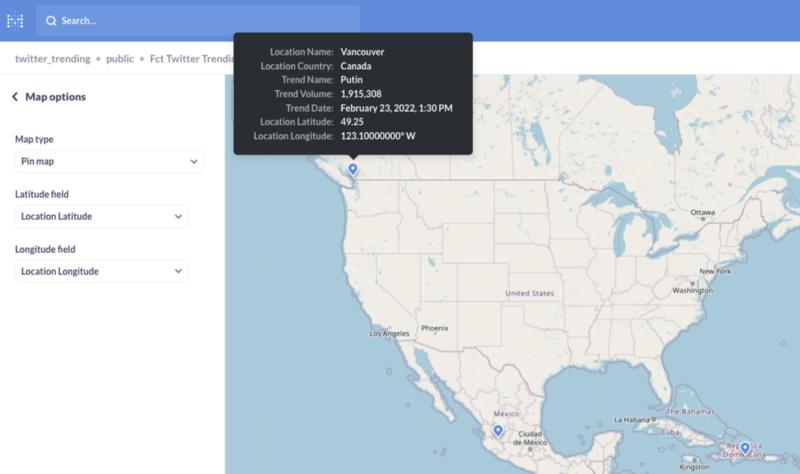
Select your materialized view and create a Pin Map visualization using our Latitude and Longitude fields.
Conclusion
The modern data stack provides us an amazingly fast getting-started experience compared to previous generations.
Setting up Redpanda is so easy compared to a Kafka cluster I spent around 30 minutes trying to find errors in my local deployment even though everything was already working.
Materialize is an amazing tool if you need live data. This small example doesn’t even begin to scratch the surface of what’s possible with it currently, and what will be in the future. Definitely worth to keep an eye on their progress.
The integration with dbt makes it easy to keep track of our view definitions and even though their live nature makes the usual scheduled dbt runs obsolete, it still provides amazing value through testing, documentation and other features that it is definitely worth to keep in our stack.
Member discussion